This web page was produced as an assignment for an undergraduate course at Davidson College. For information please contact Sarah Pyfrom (sapyfrom@davidson.edu) or Malcolm Campbell (macampbell@davidson.edu).
Review of “A Simple Screen to Identify Promoters
Conferring High Levels of Phenotypic Noise”
Introduction:
It has been shown that, even in genetically identical populations, some cells produce different amounts of the same protein. The speed at which the variation in protein output occurs suggests that the changes are not due to mutational change but rather to random fluctuation of the processes of transcription and translation within the cell. One explanation for this variation is promoters with variable protein output. Such variation could possibly be beneficial for the cell. Being able to respond quickly to environmental changes without having to mutate to adapt would be incredibly useful for a single-celled organism.
This paper suggests a new approach for screening for promoters that produce high levels of phenotypic noise. In other words, it provides a way to determine which promoters produce the most variable amount of protein. It is unique in that it takes a global approach—by looking at entire genome—rather than focusing on specific genes.
Experimental Setup:
In order to do this, they created a plasmid library with fragments of Salmonella Typhimurium. The fragments were ligated into plasmids, which contained a GFP-coding region and used to transform E. coli. The E. coli were then grown in order to multiply the plasmids, which were then extracted and injected into S. Typhimurium cells. Colonies that had plasmids containing promoters expressed GFP. Those that did not have promoters in their plasmids appeared wild type.
In order to choose colonies that variably expressed GFP, they selected only the colonies in the top 5% for brightest fluorescence. These colonies were then grown in culture for another day. After a day of growth, the bottom 5% with the least fluorescence was chosen. They repeated this process (selection of top 5%/selection of bottom 5%) a total of seven times. The hope was that they would be left with colonies that variably expressed protein (GFP) output based on the promoter encoded in their plasmid. They repeated this process for five separate populations. They also used five populations for the control, putting them through the same selection process, except colonies were randomly chosen to move onto the next selection step.
Once the final selection process had been completed, they had a large number of colonies, which matched either the control or experimental criteria (randomly chosen or selected for phenotypic expression)/ Twenty-four populations of cells were randomly chosen from both the control and experimental for future tests.
Results/Discussion:
The writers of this paper found that the promoters involved with host/bacterial interaction had the most variable promoters. This was primarily flagellar proteins, which are important for infection of the host.
In order to determine whether or not the phenotypic noise was a stable property of the cells they studied, they measured noise produced from the 240 frozen cell lines (120 from control populations and 120 from experimental) on two different days. They then compared the phenotypic noise to see if the variation was consistent and significantly different from the control population.
They did find that the noise was consistent across the different time periods and populations. In other words, colonies that contained the same plasmid produced the same amount of variation in GFP output regardless of when it was grown. The variation was not due to random environmental shifts but an inherent property of the promoter.
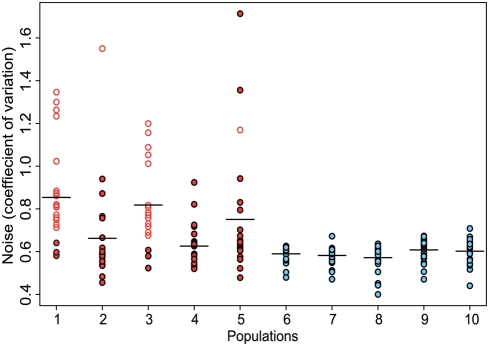
Figure 1: The x-axis is a list of the ten populations examined in this experiment. The first 5 (red) populations are the “selected” populations and the last 5 (blue) populations were the randomly selected controls. The y-axis is a measurement of noise by coefficient of variation. Circles represent a specific clone from the listed population. Open circles identify clones that contained the fliC gene in the GFP-encoding plasmid.
This figure shows that clones in populations that were exposed to alternating selection showed significantly higher coefficients of variation than did populations, which experienced only random selection. It also shows that there was high enrichment of the fliC-moderated GFP in the alternately selected populations. This provides strong evidence that the fliC promoter provides noisy protein output.

Figure 2:
Each coloured line represents the clone with the highest level of noise in one of the ten populations mentioned in Figure 1. The blue lines are the control populations and the red, yellow and orange lines are from the selected populations. The x-axis measures GFP fluorescence levels and the y-axis shows frequency of a given fluorescence level. This figure shows that all the blue lines are grouped in one most common expression level and the peaks vary very little. The warm-coloured lines show a large amount of variation. Fluorescence level was measured several times for each clone and, as you can see, each clone showed varying fluorescence levels and therefore varying GFP production. The orange lines are clones that contain the fliC promoter and each line shows a similar curve and similar peaks. This shows that, while there is variable protein output from this promoter, the variation is constant across different clones.
The investigators then focused on the fliC promoter since it was enriched in the populations showing high levels of noise. Part of their purpose in doing this was to investigate the fliC promoter, but it was also to verify that their method works.
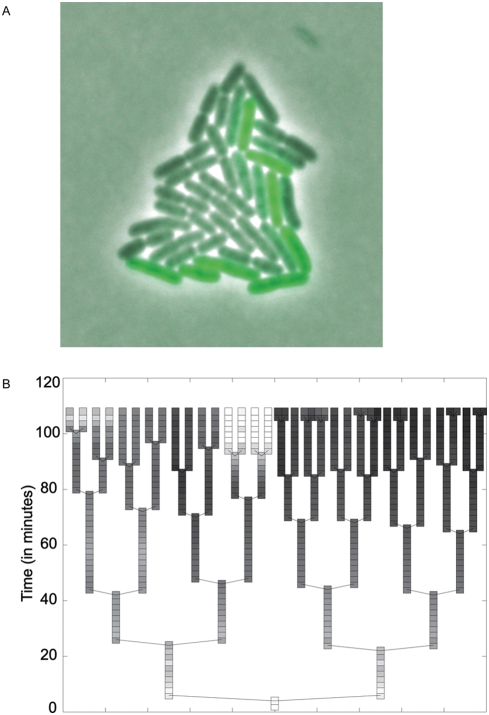
Figure 3:
This figure shows the phenotypic noise inherent in the fliC promoter. In panel A, you can see a colony of S. Typhimurium cells. This colony was grown from a single cell which contained the plasmid with a fliC-moderated GFP gene. As you can see, some cells have produced more GFP than others, even though they were all grown under the same conditions.
In panel B, we can see a lineage tree of this colony. Each branch point describes a new generation (production of new cells by division of the old). The y-axis tracks the time at which each division occurred. Light boxes represent high levels of GFP whereas dark levels represent low levels. As you can see, cells within the same generation showed drastically different levels of GFP production.
Experimental findings relevant to wild type protein production:
They first wanted to see if the promoter functioned in a similar manner in its native chromosomal location. They fixed the GFP gene to the fliC promoter within the S. Typhimurium chromosome. The paper says that GFP showed similar (varying) expression within the chromosome as it did when in the plasmid.
They then wanted to see if the fliC promoter worked on the FliC protein in the same way that it worked on GFP. They created a plasmid with the FliC promoter and the FliC protein attached to GFP. The paper says that Western blot data showed that protein production showed variation that was similar to their original findings. This suggests that the high levels of noise were in fact due to the way the promoter functions and not because of their methodology (use of plasmid and GFP).
Phase variation:
The writers of this paper admit that their findings could be because of a phenomenon called “phase variation”. This occurs when a site-specific recombination occurs between the FliC and FliB flagellar proteins. However, this kind of recombination occurs at a rate of 10^-3 to 10^-5 per cell division. Therefore it would take many divisions before altered protein expression would be observed. In the results found in this paper, colonies that were grown from one, single S. Typhimurium cell showed cells that maintained differing levels of protein expression.
To be sure that their results were not caused by phase variation, the researchers transformed two different cell types with the fliC-moderated GFP plasmid. One was a wild-type strain and the other was a strain that was incapable of phase variation. There was no significant difference between the coefficients of variation in the wild type or phase-variation deficient strains. This suggests that the noise levels they discovered were not due to phase variation.
Importance of findings:
The writers of the paper surmised that the phenotypic noise expressed by the fliC promoter might be adaptively advantageous. Diverting energy to flagella production is wasteful until the bacterium has infiltrated a host. Then the flagella are necessary for the bacteria to reach and penetrate the host’s epithelial mucus layer. After infiltration, a bacterium without flagella would be less noticeable to the host’s immune system. In this way, having a mechanism that allows S. Typhimurium to quickly alter it’s phenotype in response to its surroundings would be highly beneficial.
The writers of the paper also cite a recently published paper to suggest another purpose for the noise produced by the fliC promoter. It is possible that colonies of S. Typhimurium “divide labor” into two sob-colonies, one of which develops flagella and invades the host’s tissue while the other remains in the gut and benefits from the reduced competition brought on by the inflammation associated with invasion.
The writers of this paper present their findings as evidence that their method works. By using fluctuating selection, one could screen any genome for promoters which have high levels of phenotypic noise. They say that it is faster than making an ordered library and could be applied to almost any known species. Of course, further studies would be necessary to further explore what benefits might arise from such phenotypic noise, but it does present a starting point for the formation of further research questions.
What do I think?
I think that this is an interesting and potentially informative method…if you have nothing better to do. It might give you clear and useful results but too much of the process is based on chance.
Fragmenting the genome could produce many fragments with promoters…but it could also destroy potentially informative promoters in the process. There is very little control over how the DNA is fragmented, which is the basis for this entire experiment.
Also, the process by which they choose phenotypically fluctuating colonies is less than ideal. These fluctuating promoters do—by definition—fluctuate. If a highly variable promoter happens to be showing reduced output on the first round of selection, it will be missed entirely. Their control shows that the method does work and it does find promoters with high phenotypic noise but I would think that they also missed many promoters that they may have found interesting. This method might point you in the right direction but it could also lead you astray very easily.
Finally, their paper seems incomplete. I know that they had to cut some things out in order to fit their story into the journal, but they oftentimes simply state that their data is accurate as opposed to showing proof. Especially in the section where they are trying to prove that the variation is actually caused by the promoter and not by their method.